Three ways to build one
- Single file. Oregon's project tracking and treatment dashboard is one HTML file: every recorded occurrence and treatment statewide, detections against treatment by year, the grant projects and partners behind the work, a live treatment map with ownership layers, and a CSV and print export. Zero licence cost, deployable anywhere.
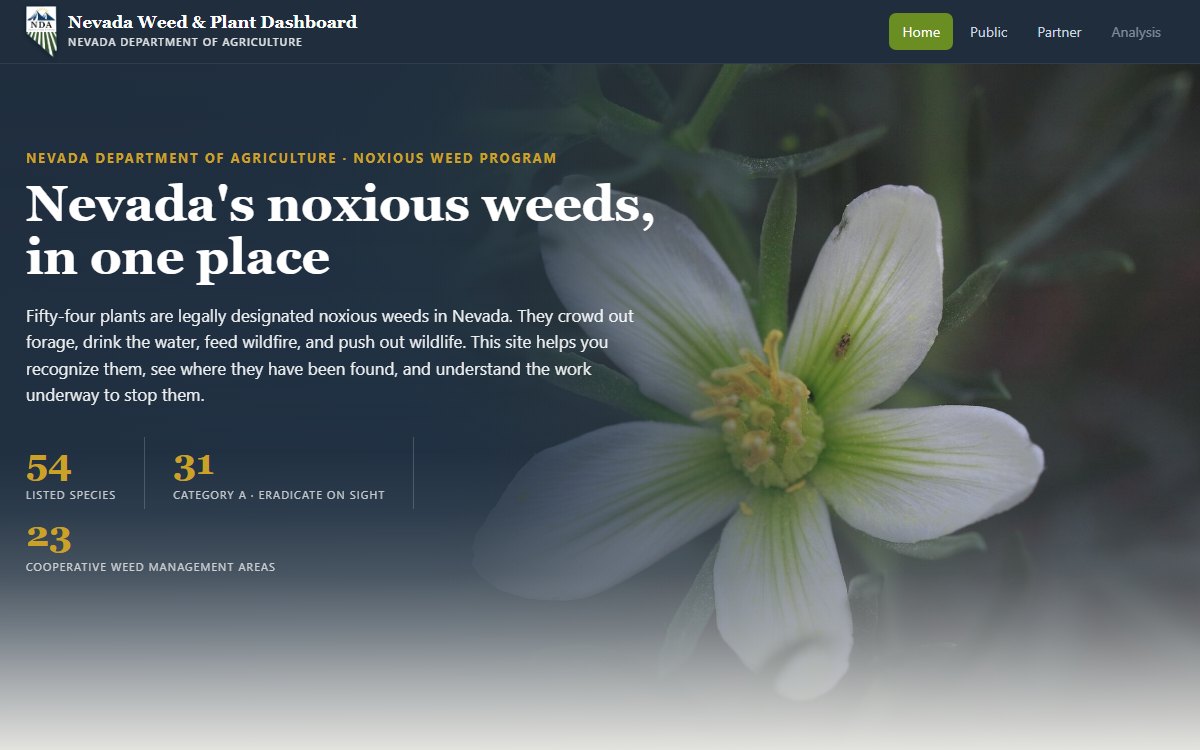
- A public site around the data. Nevada's Noxious Weed Program site puts every listed species, a live EDDMapS map, the weed projects underway and a partner workspace behind one front door, as pre-rendered static pages.
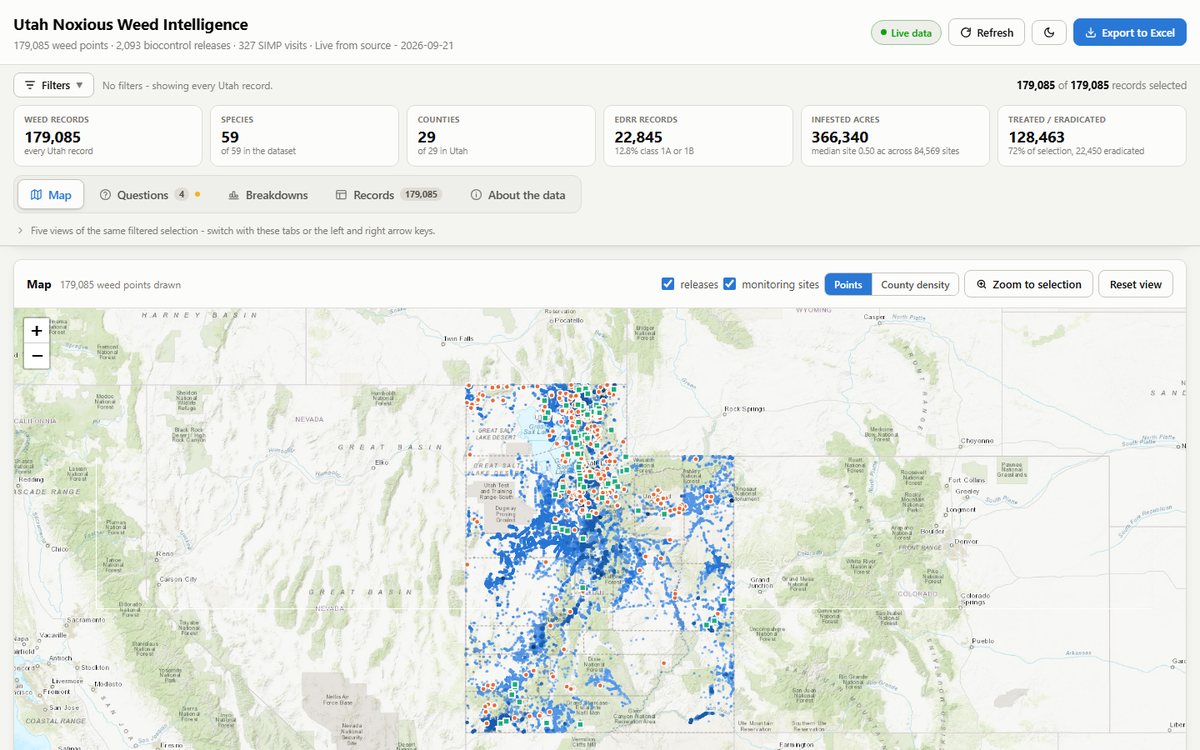
- Backed by a database. Utah's Noxious Weed Intelligence dashboard joins three live services and answers four program questions per selection, with county densities, breakdowns and Excel export. Right when the questions run across layers.
- Either way: county drill-downs, species and class filters, year comparisons, and an export designed for the annual report.
Where it runs
Dashboards in service or delivered for Colorado, Wyoming, Oregon, Idaho, Utah, Montana, Nevada, Arizona, Florida and Minnesota, plus the Western Weed Coordinating Committee's regional view. The Utah Department of Agriculture and Food's statewide web GIS has been in continuous service for years, with annual reporting designed in from the start.
Questions we are asked
- Can one dashboard cover several states?
- Yes. The Western Weed Coordinating Committee's dashboard draws member states' data into one filterable view, embedded on the committee's own site.
- Who maintains it?
- A single-file dashboard needs almost nothing. We host and maintain what we build if you want, and if you do not, the file and the documentation are yours.