The problem
Utah's weed records, its biocontrol release history and the SIMP effectiveness monitoring live in three separate services. Each is fine on its own. None of them can answer the questions a program actually asks, because those questions run across the layers: is the agent we released doing anything, and did we release it where the weed is?
What we built
One page that queries all three services live on load (and falls back to a bundled snapshot, with a badge that says which you are looking at). Species are matched across the sources on a normalised common name; SIMP sites, which carry no county, are assigned one from their coordinates. Every filter drives five views of the same selection: a map with points or county density, plus release and monitoring-site overlays; a Questions tab; breakdowns by class, county and species; the records themselves; and a plain-language page about the data and its limits.
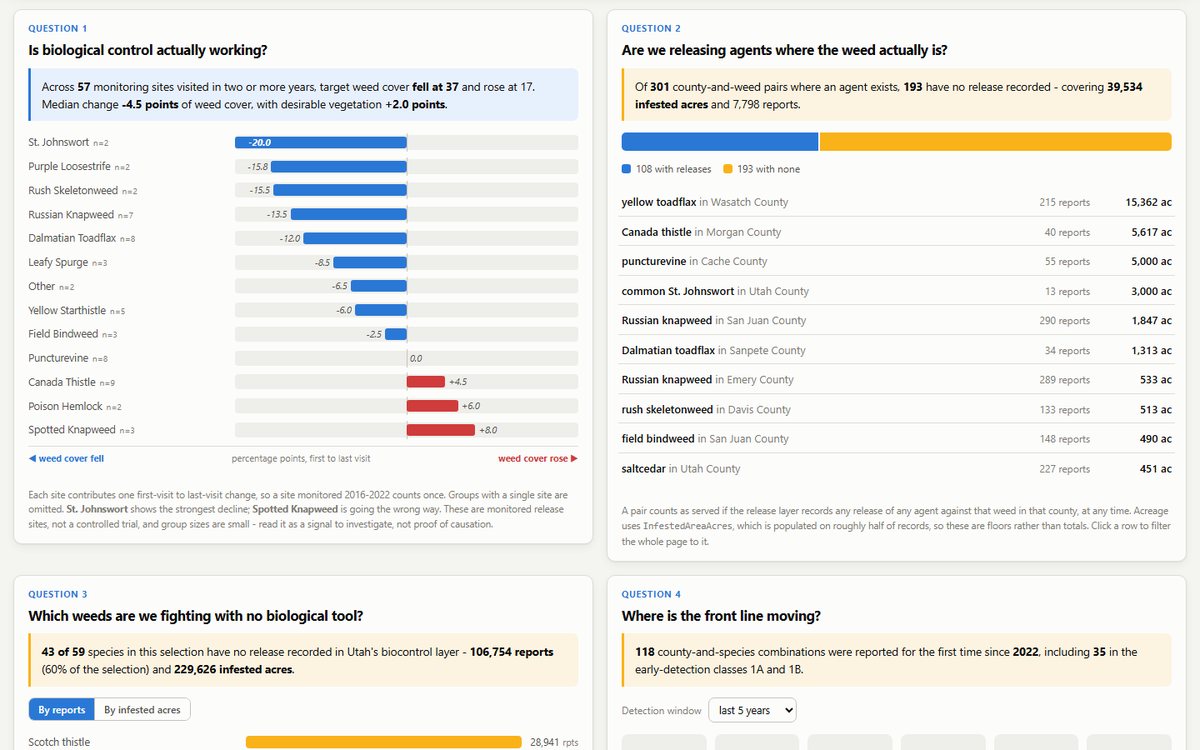
The four questions are the point of the build. Is biological control actually working? Across 57 monitoring sites visited in two or more years, target weed cover fell at 37 and rose at 17. Are we releasing agents where the weed actually is? Of 301 county-and-weed pairs where an agent exists, 193 have no release on record, covering 39,534 infested acres. Which weeds are we fighting with no biological tool? 43 of 59 species, 60% of all reports. Where is the front line moving? 118 county-and-species combinations reported for the first time since 2022, 35 of them in the early-detection classes.
What it changed
The honest caveats are on the page, not in a footnote: a blank area is survey effort, not absence; every acreage total shows its median beside it because one record claims 20,000 acres; weed class is carried by marker size as well as colour. A coordinator can filter to a county and a weed, read the four answers, and hand the board a spreadsheet with the same numbers.